
NEPA Car Accidents, Truck Crashes, ATV Injuries & Workplace Injury Data – 2026 Update
Understanding injury trends in Northeastern Pennsylvania helps drivers, workers, and families make informed decisions. It also helps communities identify patterns that impact public safety.
The NEPA Injury Statistics Hub compiles publicly available data from PennDOT, the Pennsylvania Department of Labor & Industry, OSHA, and federal safety databases to provide a regional overview of injury-related incidents across:
- Lackawanna County
- Luzerne County
- Wayne County
- Monroe County
- Pike County
This dashboard is updated annually to reflect the most recent reporting year.
Car Accident Statistics – NEPA
Motor vehicle crashes remain the leading cause of injury in Northeastern Pennsylvania.
Lackawanna County
- Total Reportable Crashes: 1,700+
- Injury Crashes: 600+
- Fatal Crashes: 20+
- DUI-Related Crashes: 140+
- Speed-Related Crashes: 400+
Luzerne County
- Total Reportable Crashes: 2,200+
- Injury Crashes: 800+
- Fatal Crashes: 30+
Urban corridors in Scranton and Wilkes Barre account for a disproportionate share of injury crashes.
- Peak crash periods:
- Weekdays 3 PM – 6 PM
- Fridays and weekends
- Late night DUI window 10 PM – 2 AM
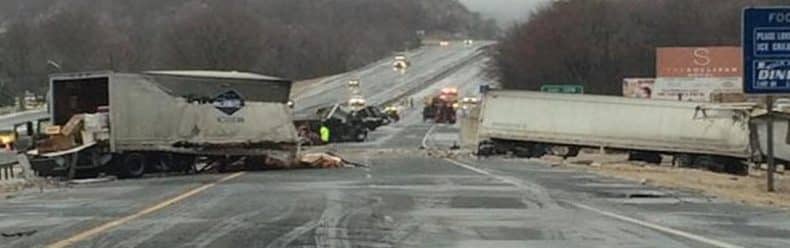
Truck Accident Statistics – Commercial Vehicle Crashes
Commercial vehicle involvement increases the severity of injury crashes.
Across NEPA:
- Truck-Involved Crashes Annually: 300+
- Truck-Involved Injury Crashes: 100+
- High-Risk Corridors:
- I-81
- Route 6
- Keyser Avenue
- Interstate interchanges near Pittston and Dunmore
Truck crashes frequently involve rear-end collisions and lane-change accidents.
Motorcycle Crash Data – NEPA
Motorcycle crashes represent a smaller percentage of total crashes but produce a higher rate of serious injury.
- Motorcycle Crashes Annually (NEPA Combined Counties): 150+
- Serious Injury Rate: Significantly higher than passenger vehicle crashes
- Peak Season: May through September
Helmet compliance reduces fatality risk, but severe injuries remain common even in lower-speed collisions.
Pedestrian Injury Trends
Pedestrian crashes, while less frequent, result in a disproportionately high rate of serious injury.
- NEPA Pedestrian Crashes Annually: 90+
- High Concentration Areas:
- Downtown Scranton
- Downtown Wilkes Barre
- University-adjacent areas
- Retail corridors
Common contributing factors:
- Failure to yield
- Poor visibility
- Distracted driving
ATV Accident & Recreational Vehicle Injuries
ATV use is common in rural portions of NEPA.
- Reported ATV-Related Injuries Annually (Regional Estimate): 70+
- Common injury causes:
- Rollovers
- Unrestrained passengers
- Mechanical failures
- Youth operator inexperience
Certain vehicle recalls and restraint malfunctions have raised product liability concerns in recent years.
Workplace Injury Statistics – NEPA
Industries with higher reported injury rates:
- Construction
- Manufacturing
- Warehousing
- Healthcare
Pennsylvania Department of Labor data shows:
- Thousands of reportable workplace injuries statewide each year
- NEPA accounts for a measurable share tied to industrial and construction sectors
Common workplace injury types:
- Falls
- Struck-by incidents
- Equipment-related injuries
- Repetitive stress injuries
DUI & Impaired Driving Trends
DUI remains a contributing factor in a significant portion of injury crashes.
- NEPA DUI-Related Crash Estimate: 8–10% of total crashes
- Higher frequency:
- Weekends
- Holiday periods
- Late night hours
Injury Severity Trends Across Categories
Across all categories:
- Passenger vehicle crashes produce the highest total number of injuries.
- Motorcycle and pedestrian crashes produce the highest severity rates.
- Commercial vehicle crashes produce higher average medical cost claims.
- ATV crashes frequently involve traumatic injury due to rollover dynamics.
Why This Data Matters
Understanding regional injury patterns helps:
- Drivers identify high-risk corridors
- Workers recognize industry risks
- Parents assess ATV safety concerns
- Communities advocate for infrastructure improvements
This dashboard is intended to serve as a public safety resource for Northeastern Pennsylvania.
Methodology
Data compiled from publicly available:
- Pennsylvania Department of Transportation crash statistics
- Pennsylvania Department of Labor & Industry injury reporting
- OSHA regional data
- Consumer Product Safety Commission incident reports
Figures reflect the most recent complete reporting year available at time of publication.
FAQ
Q1: What county in NEPA has the highest number of car accidents?
Luzerne and Lackawanna Counties typically report the highest total crash volumes due to population density and traffic flow.
Q2: Are truck accidents common in Northeastern Pennsylvania?
Yes, commercial vehicle crashes occur regularly along major corridors such as I-81 and Route 6.
Q3: Do pedestrian crashes result in more severe injuries?
Pedestrian crashes often result in higher injury severity compared to standard passenger vehicle collisions.
Q4: When do most DUI crashes occur in NEPA?
Late night hours and weekends show higher DUI-related crash frequency.
Q5: Which industries report the most workplace injuries in NEPA?
Construction, manufacturing, warehousing, and healthcare sectors report higher injury rates.

